|
This web page contains background info on how I became familiar with radar
rainfall conversion and is no longer updated. Info includes DBZ Rainfall rates,
Wunderground weather stations, and what can go wrong does. Or to quote from a
man of experience, Cousin Woodman, "Good judgment comes from experience, and
experience -- well, that comes from poor judgment." ...in spades. I didn't
know then what I know now, that you have to adjust the radar... not the rain
gages!!!
****PLEASE
NOTE**
Wunderground rainfall accumulation parameter 'dailyrainin' is
now preferred over 'HourlyPrecipIn' because some gages may be true hourly rates but others
are a lagging moving 60 minute total, and some
are really odd, so be safer
than sorry and use dailyrainin.
This goes along way in explaining dead wasps in some tipping buckets here. Getrealtime.exe was updated 7/2/2012 to convert the
Wunderground accumulating dailyrainin
values to unit increments.
The following page
links
have rainfall comparisons that I am currently updating:
Current
Radar Adjusted Rainfall Comparison
Charlotte, NC
Current Rainfall/Snowmelt Comparison
Beech Mtn, NC
Runoff Comparison
with Adjusted Rdar in Las Vegas, NV
Adjusted
Radar/Smowmelt Runoff Comparison
in San Joaquin Valley, CA
Runoff Comparisons
in Arizona
Snowfall
Snowpack Snowmelt Comparisons
Rainfall Comparison
Ft Lauderdale, FL
ET and Rainfall along
the Lower Colorado River, AZ-CA
Primary directive... never trust reported rain gage data
(and pilots). Look
at the time steps, sharpness of rain spikes, minimum windspeed, and completeness
of all parameters to gauge how carelessly stupid the provider is. This means airports are
usually off the menu to start. Airports only service pilots and we are not dumb
enough to want to fly in the rain. Wundergages that start with "K" are usually alot better
than those that start with "M". Irratic time steps are not a deal killer but if
possible find another gage. Compare annual rainfall totals for other nearby
Wundergages and pick the highest... something I did not do and you should. As it
turns out, I would say your NEXRAD computed
rainfall is probably better than 50% to 80% of Wundergages. Live and learn... or
believe me, I have flown these unfriendly skies. Those that
consciencentiously make the effort to provide a good rainfall record are a
credit to the human race... unlike some pilots at airports. ;-)
My critique here only applies to reported rainfall... temperature, humidity, and
windspeed is something even pilots can usually report accurately. I hope. ;-)
*************Update
8/27/2012***************
My expert Dave in Alabama tells me I have pilots all wrong and also the Kxxx
Wunderground precip at Airports. He points out that the NWS empty and reset
their precip buckets at 7 minutes till the hour every hour. What a job that must
be. So Kxxx Wunderground airport precip parameter 'PrecipitationIn' now works in
GetRealtime.exe. Sorry about that pilots but I still wouldn't fly in the rain
and airport time steps are all screwy anyway.
****************************
...Testing... Testing... Let's see how NEXRAD works for computing
rainfall in real-time at real-time rain gages, really.
(NOAA's Summary
here a must read.)
The first half of the this web page is what I went through getting my feet wet
with the ins and outs of NEXRAD radar and the quirks of Wunderground rain
gages. This part will be interesting to follow if you are a newbie to this stuff
like I am and a good laugh for you experts. The second half of this web page is
where my on going NEXRAD vs Tipping Bucket comparisons are shown in a more
concise graphical format. The tipping bucket rain
gages are located at:
1) Fort Lauderdale, Fl
2) Dallas, Tx
3) Collinsville, TX
4) Groveland, Ca (northern San Joaquin Valley foot hills)
5) Buck Meadows, Ca (northern San Joaquin Valley foot hills)
6) Tracy, Ca (northern San Joaquin Valley)
7) McFarland, Ca (southern San Joaquin Valley)
8) My Plastic Gage, Southern Nevada
9) USGS Diamond Creek Gage, AZ (Canyon Lands northwest AZ)
10) USGS Big Sandy River Gage, AZ (Sonoran Desert west central AZ)
11) USGS Santa Maria River Gage, AZ (Sonoran Desert west central AZ)
12) Wundergage Camp Wood, AZ (Upper Sonora west central AZ)
13) Additional comparisons for winter snowfall and radar performance discussions
can be seen
here.
You might ask why all my sites are located in the southern US. Well, I did not
know that NEXRAD radar worked when it snowed... live and learn (those are some
smart guys at NEXRAD headquarters!). I have now added
comparisons
with snow water content gauges in the western Sierra Nevadas that doesn't
make those guys at headquarters look to smart after all. Additionally, NEXRAD comparisons with a
professional network of tipping buckets are on my
Rainfall-Runoff Comparisons web page for
Las Vegas Valley, Nv.
Fit
the First (Oy Vey)
The Bellman looked uffish, and wrinkled his brow.
"If only you'd spoken before!
It's excessively awkward to mention it now,
With the Snark, so to speak, at the door!
"We should all of us grieve, as you well may believe,
If you never were met with again--
But surely, my man, when the voyage began,
You might have suggested it then?
"It's excessively awkward to mention it now--
As I think I've already remarked."
And the man they called "Carson!" replied, with a sigh,
"I informed you the day we embarked.
"You may charge me with murder--or want of sense--
(We are all of us weak at times):
But the slightest approach to a false pretense
Was never among my crimes!
"I said it in Hebrew--I said it in Dutch--
I said it in German and Greek:
But I wholly forgot (and it vexes me much)
That English is what you speak!"
"What's the good of Mercator's North Poles and Equators,
Tropics, Zones, and Meridian Lines?"
So the Bellman would cry: and the crew would reply
"They are merely conventional signs!
"Other maps are such shapes, with their islands and capes!
But we've got our brave Captain to thank:
(So the crew would protest) "that he's bought us the best--
A perfect and absolute blank!"
This was charming, no doubt; but they shortly found out
That the Captain they trusted so well
Had only one notion for crossing the ocean,
And that was to tingle his bell.
Let the Snark Hunt begin. ;-)
A storm moved through the KFLCORAL5 weather station area today (June 8, 09) and
the N0R and NCR correlated well with the weather station reported total rainfall
amount. The N1P 1-hour total had a
bug that has been fixed and is now available for download.
WunderG
Nexrad Nexrad
Date
KFLCORAL5 N0R NCR
6/8/2009 15:00
0.1042
0
0.00694
6/8/2009 16:00
0.0258
0
0.01111
6/8/2009 17:00
0
0 0.01042
6/8/2009 18:00
0.1312
0.60416 0.43055
6/8/2009 19:00
0.486
0.06919 0.16966
6/8/2009 20:00
0.0025
0.00417 0.06765
TOTAL
0.7497
0.67752 0.69633
The above graph of the 5-minute rainfall amounts paint a different picture.
Although the N0R and NCR values agree, their distribution is certainly different
than those reported by the weather station. Perhaps the rain fell as hail and
had to melt to be recorded by the weather station??? Hence it's even
distribution that seems odd for a rapidly moving thunderstorm.
The Fort Lauderdale airport National Weather Service located about 15 miles down
wind from our Wunder gage reported:
6:03 PM,N/A,,Overcast
6:28 PM,0.17,Rain
6:33 PM,0.19,Rain
6:37 PM,0.19,Rain
6:53 PM,0.19,Rain
7:53 PM,0.00,Rain
Total = 0.74
I quess the NWS can melt hail faster?
If anyone is following along I switched to this new rain gage. It agrees with
the results for the gage above, but it appears even better maintained.
New Wunderground Weather Station:
KFLPARKL4
New Boundary file:
Edited for better square Area1 X,Y Coordinates (pix)
322, 184
322, 186
324, 186
324, 184
322, 184
Xmin 322, Ymin 184, Xmax 324, Ymax 186
Area1= 2.20 (pix^2), Perimeter= 7.17 (pix), Centroid= 323, 185
New Point file:
323,185,323,185
1
Another Comaprison... Similar results:.
My method used for the N1P 5-minute values in the tables below were computed as
the change in the Nexrad values and has been subsequently abandoned because of
its unreliable results. The N1P is now simply the the N1P value as a 1 hour rate
just like N0R and NCR which means it lags and averages the rainfall record over
an hour period... which is fine for larger basins and IF the N1P wasn't so lousy
anyway!
|
13-Jun-09
|
5-minute
|
5-minute
|
5-minute
|
5-minute
|
Total
|
Total
|
Total
|
Total
|
|
|
WunderG
|
NEXRAD
|
NEXRAD
|
NEXRAD
|
WunderG
|
NEXRAD
|
NEXRAD
|
NEXRAD
|
|
Date
|
KFLPARKL4
|
N0R
|
NCR
|
N1P
|
KFLPARKL4
|
N0R
|
NCR
|
N1P
|
|
3:00 PM
|
0
|
0
|
0
|
0
|
0
|
0
|
0
|
0
|
|
3:05 PM
|
0
|
0
|
0.04167
|
0
|
0
|
0
|
0.04167
|
0
|
|
3:10 PM
|
0
|
0
|
0.125
|
0
|
0
|
0
|
0.16667
|
0
|
|
3:15 PM
|
0
|
0
|
0.125
|
0
|
0
|
0
|
0.29167
|
0
|
|
3:20 PM
|
0
|
0
|
0.125
|
0
|
0
|
0
|
0.41667
|
0
|
|
3:25 PM
|
0
|
0
|
0.00417
|
0
|
0
|
0
|
0.42084
|
0
|
|
3:30 PM
|
0
|
0
|
0.0075
|
0
|
0
|
0
|
0.42834
|
0
|
|
3:35 PM
|
0
|
0
|
0.02083
|
0
|
0
|
0
|
0.44917
|
0
|
|
3:40 PM
|
0
|
0.00417
|
0.0625
|
0
|
0
|
0.00417
|
0.51167
|
0
|
|
3:45 PM
|
0.00167
|
0.01167
|
0.04167
|
0
|
0.00167
|
0.01584
|
0.55334
|
0
|
|
3:50 PM
|
0.00667
|
0.0625
|
0.125
|
0
|
0.00834
|
0.07834
|
0.67834
|
0
|
|
3:55 PM
|
0.00917
|
0.125
|
0.125
|
0
|
0.01751
|
0.20334
|
0.80334
|
0
|
|
4:00 PM
|
0.01333
|
0.125
|
0.125
|
0.25
|
0.03084
|
0.32834
|
0.92834
|
0.25
|
|
4:05 PM
|
0.0225
|
0.125
|
0.125
|
0.5
|
0.05334
|
0.45334
|
1.05334
|
0.75
|
|
4:10 PM
|
0.03833
|
0.0625
|
0.125
|
0.25
|
0.09167
|
0.51584
|
1.17834
|
1
|
|
4:15 PM
|
0.05417
|
0.0625
|
0.125
|
0
|
0.14584
|
0.57834
|
1.30334
|
1
|
|
4:20 PM
|
0.0625
|
0.0625
|
0.125
|
0.2
|
0.20834
|
0.64084
|
1.42834
|
1.2
|
|
4:25 PM
|
0.06417
|
0.04167
|
0.0625
|
0
|
0.27251
|
0.68251
|
1.49084
|
1.2
|
|
4:30 PM
|
0.06583
|
0.02083
|
0.02083
|
0
|
0.33834
|
0.70334
|
1.51167
|
1.2
|
|
4:35 PM
|
0.06583
|
0.02083
|
0.02083
|
0
|
0.40417
|
0.72417
|
1.5325
|
1.2
|
|
4:40 PM
|
0.06667
|
0.02083
|
0.02083
|
0
|
0.47084
|
0.745
|
1.55333
|
1.2
|
|
4:45 PM
|
0.065
|
0.0075
|
0.01167
|
0
|
0.53584
|
0.7525
|
1.565
|
1.2
|
|
4:50 PM
|
0.06
|
0
|
0.0075
|
0
|
0.59584
|
0.7525
|
1.5725
|
1.2
|
|
4:55 PM
|
0.0575
|
0
|
0
|
0
|
0.65334
|
0.7525
|
1.5725
|
1.2
|
|
5:00 PM
|
0.05333
|
0
|
0
|
0
|
0.70667
|
0.7525
|
1.5725
|
1.2
|
|
5:05 PM
|
0.04417
|
0
|
0
|
0
|
0.75084
|
0.7525
|
1.5725
|
1.2
|
|
5:10 PM
|
0.02833
|
0
|
0
|
0
|
0.77917
|
0.7525
|
1.5725
|
1.2
|
|
5:15 PM
|
0.0125
|
0
|
0
|
0
|
0.79167
|
0.7525
|
1.5725
|
1.2
|
|
5:20 PM
|
0.00417
|
0
|
0
|
0
|
0.79584
|
0.7525
|
1.5725
|
1.2
|
|
5:25 PM
|
0.0025
|
0
|
0
|
0
|
0.79834
|
0.7525
|
1.5725
|
1.2
|
|
5:30 PM
|
0.00083
|
0
|
0
|
0
|
0.79917
|
0.7525
|
1.5725
|
1.2
|
|
5:35 PM
|
0.00083
|
0
|
0
|
0
|
0.8
|
0.7525
|
1.5725
|
1.2
|
|
5:40 PM
|
0
|
0
|
0
|
0
|
0.8
|
0.7525
|
1.5725
|
1.2
|
It looks like the N0R radar image is the best of the lot. The NCR and N1P were
not even in the ballpark.
Another comparison …
|
16-Jun-09
|
5-minute
|
5-minute
|
5-minute
|
5-minute
|
Total
|
Total
|
Total
|
Total
|
|
|
WunderG
|
NEXRAD
|
NEXRAD
|
NEXRAD
|
WunderG
|
NEXRAD
|
NEXRAD
|
NEXRAD
|
|
Date
|
KFLPARKL4
|
N0R
|
NCR
|
N1P
|
KFLPARKL4
|
N0R
|
NCR
|
N1P
|
|
4:50 PM
|
0
|
0
|
0
|
0
|
0
|
0
|
0
|
0
|
|
4:55 PM
|
0
|
0
|
0.00417
|
0
|
0
|
0
|
0.00417
|
0
|
|
5:01 PM
|
0
|
0.0075
|
0.0625
|
0
|
0
|
0.0075
|
0.06667
|
0
|
|
5:06 PM
|
0
|
0.00417
|
0.0625
|
0
|
0
|
0.01167
|
0.12917
|
0
|
|
5:10 PM
|
0
|
0.02083
|
0.5
|
0
|
0
|
0.0325
|
0.62917
|
0
|
|
5:15 PM
|
0
|
0.01167
|
0.25
|
0
|
0
|
0.04417
|
0.87917
|
0
|
|
5:21 PM
|
0
|
0.00417
|
0.25
|
0
|
0
|
0.04834
|
1.12917
|
0
|
|
5:25 PM
|
0.002
|
0.0075
|
0.25
|
0
|
0.002
|
0.05584
|
1.37917
|
0
|
|
5:30 PM
|
0.005
|
0.00417
|
0.125
|
0
|
0.007
|
0.06001
|
1.50417
|
0
|
|
5:36 PM
|
0.008
|
0.00417
|
0.0625
|
0
|
0.015
|
0.06418
|
1.56667
|
0
|
|
5:40 PM
|
0.00533
|
0.00417
|
0.02083
|
0
|
0.02033
|
0.06835
|
1.5875
|
0
|
|
5:46 PM
|
0.008
|
0
|
0
|
0
|
0.02833
|
0.06835
|
1.5875
|
0
|
|
5:50 PM
|
0.00533
|
0
|
0
|
0
|
0.03366
|
0.06835
|
1.5875
|
0
|
|
5:55 PM
|
0.0075
|
0
|
0
|
0
|
0.04116
|
0.06835
|
1.5875
|
0
|
|
6:00 PM
|
0.0075
|
0
|
0
|
0
|
0.04866
|
0.06835
|
1.5875
|
0
|
|
6:06 PM
|
0.009
|
0
|
0
|
0
|
0.05766
|
0.06835
|
1.5875
|
0
|
|
6:11 PM
|
0.0075
|
0
|
0
|
0
|
0.06516
|
0.06835
|
1.5875
|
0
|
|
6:16 PM
|
0.0075
|
0
|
0
|
0
|
0.07266
|
0.06835
|
1.5875
|
0
|
|
6:20 PM
|
0.006
|
0
|
0
|
0
|
0.07866
|
0.06835
|
1.5875
|
0
|
|
6:25 PM
|
0.005
|
0
|
0
|
0
|
0.08366
|
0.06835
|
1.5875
|
0
|
|
6:30 PM
|
0.0025
|
0
|
0
|
0
|
0.08616
|
0.06835
|
1.5875
|
0
|
|
6:36 PM
|
0.001
|
0
|
0
|
0
|
0.08716
|
0.06835
|
1.5875
|
0
|
|
6:40 PM
|
0.00067
|
0
|
0
|
0
|
0.08783
|
0.06835
|
1.5875
|
0
|
|
6:45 PM
|
0.00083
|
0
|
0
|
0
|
0.08866
|
0.06835
|
1.5875
|
0
|
|
6:50 PM
|
0.00083
|
0
|
0
|
0
|
0.08949
|
0.06835
|
1.5875
|
0
|
|
6:55 PM
|
0
|
0
|
0
|
0
|
0.08949
|
0.06835
|
1.5875
|
0
|
It looks like N0R is the only viable Radar Image for point rainfall
determinations. That is good because
N1P is a pain in the… you know what.
NCR is just laughable. They may both
have value for larger areas and larger storms, but why bother. (update...
obviously I was a radar rube, turns out NOAA knows what they are doing. Just use the N0R
and dont embarrass yourself like me.)
The time lag between N0R rainfall and Wunderground seems to be due to something
peculiar to Wunderground. The radar
clearly showed this small storm had moved out of the area yet Wunderground was
still reporting rainfall 30 minutes later.
I would like to pick a Wunderground gage in my area for visual
confirmation, but it never rains in the desert!
Ok, it’s on my list.
Daily Comparisons for past 7 days
Here are daily rainfalls for the past week. I think N1P and NCR are shown not to be worth further comparisons.
What say you?!!
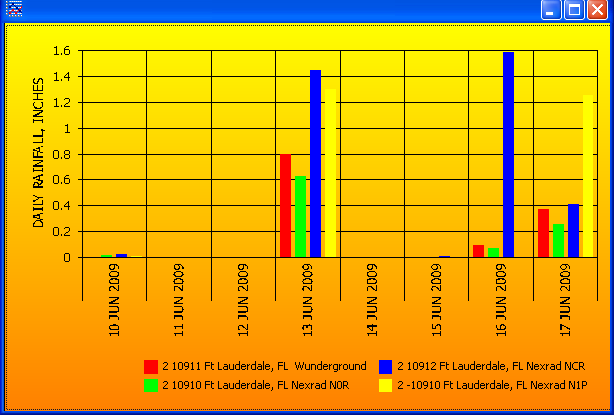
The final blow or the coupe de gras (i hope that's french or latin) is revealed
on June 16. NCR says 1.6" and N1P says zero. What goes on at Nexrad
headquarters anyway?!! ;-)
The Wunderground rain gage storm duration is again very long so I have moved to
another new Wunderground gage a few miles away in Boca Raton, FL. This gage
showed a strong peak and a duration about the same as what the radar showed.
And I am not trying to cherry pick my intended results (too much). I
just doubt thunderstorms this time of year look like drizzle. Do these
Wundergrounders ever check for bird nests in their tipping buckets??? I
quess science isn't always as cheap as one hopes. ;-)
KFLBOCAR4
The boundary file is:
KFLBOCAR4 Area1 X,Y Coordinates (pix)
324, 182
324, 184
326, 184
326, 182
324, 182
Xmin 324, Ymin 182, Xmax 326, Ymax 184 Area1= 2.20 (pix^2), Perimeter= 7.17
(pix), Centroid= 325, 183
The point file is:
325,183,325,183
1
Temporarily had to move to
Melborne MLB radar as AMX was down.
|
23-Jun-09
|
5-minute
|
5-minute
|
|
Total
|
Total
|
|
PDT
|
WunderG
|
NEXRAD
|
|
WunderG
|
NEXRAD
|
|
Date
|
KFLBOCAR4
|
N0R
|
|
KFLBOCAR4
|
N0R
|
|
12:30
|
0
|
0
|
|
0
|
0
|
|
12:35
|
0
|
0.0625
|
|
0
|
0.0625
|
|
12:40
|
0.62333
|
0.125
|
|
0.62333
|
0.1875
|
|
12:45
|
0.52167
|
0.0625
|
|
1.145
|
0.25
|
|
12:50
|
0.215
|
0.04167
|
|
1.36
|
0.29167
|
|
12:55
|
0.07917
|
0.04167
|
|
1.43917
|
0.33334
|
|
13:00
|
0.096
|
0.0625
|
|
1.53517
|
0.39584
|
|
13:05
|
0.01067
|
0.0625
|
|
1.54584
|
0.45834
|
|
13:10
|
0.011
|
0.0075
|
|
1.55684
|
0.46584
|
|
13:15
|
0.004
|
0.01167
|
|
1.56084
|
0.47751
|
|
13:20
|
0.00417
|
0.0075
|
|
1.56501
|
0.48501
|
|
13:25
|
0.00417
|
0.01167
|
|
1.56918
|
0.49668
|
|
13:30
|
0.00417
|
0.01167
|
|
1.57335
|
0.50835
|
|
13:35
|
0.00417
|
0.02083
|
|
1.57752
|
0.52918
|
|
13:40
|
0.00583
|
0.02083
|
|
1.58335
|
0.55001
|
|
13:45
|
0.00583
|
0.02083
|
|
1.58918
|
0.57084
|
|
13:50
|
0.00417
|
0.02083
|
|
1.59335
|
0.59167
|
|
13:55
|
0.004
|
0.01167
|
|
1.59735
|
0.60334
|
|
14:00
|
0.00333
|
0.01167
|
|
1.60068
|
0.61501
|
|
14:05
|
0.00267
|
0.02083
|
|
1.60335
|
0.63584
|
|
14:10
|
0.00333
|
0.02083
|
|
1.60668
|
0.65667
|
|
14:15
|
0.00333
|
0.02083
|
|
1.61001
|
0.6775
|
|
14:20
|
0.004
|
0.01167
|
|
1.61401
|
0.68917
|
|
14:25
|
0
|
0
|
|
1.61401
|
0.68917
|
|
14:30
|
0
|
0
|
|
1.61401
|
0.68917
|
Well this comparison does not
look good!
I have reevaluated my dbz to rainfall rates and updated Getrealtime.exe to
use the log interpolation values from the following table. This will tend
to lower the low rates and greatly raise the higher rates.
NWS Nexrad N0R & NCR dbz versus rainfall rate in inches (Z = 200R^1.6
mm/hr)
Dbz
in/hr
|
65
|
16+
|
|
60
|
8
|
|
55
|
4
|
|
52
|
2.5
|
|
47
|
1.25
|
|
41
|
0.5
|
|
36
|
0.25
|
|
30
|
0.1
|
|
20
|
Trace
|
Another NWS table had the following values which I have adopted on 6/29/09. The NWS table only covered the values
through 55 dbz and listed the remaining as greater than 5.67. Here is the table I am now using:
Table 6/29/07 (above 60 dbz revised 12/17/09):
|
Reflectivity (dBz)
|
Rainfall Rate (inches/hr
)
|
|
20
|
0.02
|
|
25
|
0.04
|
|
30
|
0.09
|
|
35
|
0.21
|
|
40
|
0.48
|
|
45
|
1.10
|
|
50
|
2.49
|
|
55
|
5.67
|
|
60
|
6
|
|
65
|
6.5
|
|
70
|
7
|
|
75+
|
8
|
This table seems to have been constructed from a mid range Z-R relation of the
form Z=a+b*log(R) where a=27.14 and b=14.108 (a=46.96 for in/hr) and not a slightly different
classical step Z=aR^b form which by the way is only a statistical, not a
physical thing. It seems to work really well so if anyone can tell me more about
this Z-R please comment or email me. And isn't there some statistical rule
against just reversing the dependent and independant variables in a regression formula to
get rain rates. I guess that is the least of the problems here.
Update 8/17/10: It turns out the rates above are actually not mid range
such as 22.5 but actually the standard convective WSR-88D rates at the stated
dbz. So color green 20 dbz >>> 200R^1.4 gives the right value stated of 0.02
in/hr. Well that is a load off! But what is with the 5 dbz color bins and
not the 0.5 dbz resolution of the radar??? This is not 1988 with just 16
colors anymore.
The formulas below are from the NOAA ROC for other conversions you may wish to
try:
Marshall-Palmer (Z=200R^1.6) General stratiform precipitation
East-Cool Stratiform (Z=130R^2.0) Winter precipitation - east of
continental divide
West-Cool Stratiform (Z=75R^2.0) Winter precipitation - west ofcontinental
divide
WSR-88D Convective (Z=300R^1.4) Summer deep convection
Rosenfeld Tropical (Z=250R^1.2) Tropical convective
My Semi-Tropical (no z-r) Average of Tropical and Convective
|
Reflectivity (dBz) |
Rainfall Rate inches/hr |
Marshall Palmer |
East Cool |
West Cool |
WRD-88D convective |
My Semi-
Tropical |
Tropical |
|
10 |
-- |
0 |
0.01 |
0.01 |
0 |
0 |
0 |
|
15 |
-- |
0 |
0.02 |
0.03 |
0 |
0 |
0 |
|
20 |
0.02 |
0.03 |
0.03 |
0.05 |
0.02 |
0.02 |
0.02 |
|
25 |
0.04 |
0.05 |
0.06 |
0.08 |
0.04 |
0.04 |
0.05 |
|
30 |
0.09 |
0.11 |
0.11 |
0.14 |
0.09 |
0.11 |
0.12 |
|
35 |
0.21 |
0.22 |
0.19 |
0.26 |
0.21 |
0.27 |
0.33 |
|
40 |
0.48 |
0.45 |
0.35 |
0.45 |
0.48 |
0.67 |
0.85 |
|
45 |
1.1 |
0.93 |
0.61 |
0.81 |
1.10 |
1.66 |
2.22 |
|
50 |
2.49 |
1.91 |
1.09 |
1.44 |
2.50 |
4.15 |
5.80 |
|
55 |
5.67 |
3.93 |
1.94 |
2.56 |
5.20 |
6.86 |
8.52 |
|
60 |
6 |
5.20 |
3.45 |
4.55 |
5.20 |
7.0 |
8.52 |
|
65 |
6.5 |
5.20 |
5.20 |
5.20 |
5.20 |
7.5 |
8.52 |
|
70 |
7 |
5.20 |
5.20 |
5.20 |
5.20 |
8.0 |
8.52 |
|
75 |
8 |
5.20 |
5.20 |
5.20 |
5.20 |
8.5 |
8.52 |
You may want to limit the maximum rainfall rates for your point of interest.
Proper use of adaptable
parameters. "As mentioned earlier, several adaptable parameters have a
bearing on the precipitation algorithm. Two such adaptable parameters are the
Z/R relationship and the maximum precipitation rate (MXPRA). The default Z/R
relationship in the WSR-88D is the Convective Z=300R1.4, and the default MXPRA
was established at 53 dBZ which equates to a maximum rainfall rate of 103.8
mm/hr (4.09 in/hr). This value was established to eliminate the effects of hail
contamination on rainfall estimates, but on occasion, rainfall rates of greater
than 103.8 mm/hr were observed."
Comparison 6/24/09: Miami AMX radar back up and was used
for this comparison. It looks like
the new dbz to rainfall rate may be helping.
|
24-Jun-09
|
5-minute
|
5-minute
|
|
Total
|
Total
|
|
PDT
|
WunderG
|
NEXRAD
|
|
WunderG
|
NEXRAD
|
|
Date
|
KFLBOCAR4
|
N0R
|
|
KFLBOCAR4
|
N0R
|
|
13:00
|
0
|
0
|
0
|
0
|
0
|
|
13:05
|
0
|
0.00167
|
0
|
0
|
0.00167
|
|
13:10
|
0
|
0.00167
|
0
|
0
|
0.00334
|
|
13:15
|
0
|
0.0125
|
0
|
0
|
0.01584
|
|
13:20
|
0.0075
|
0.0525
|
0.0075
|
0.0075
|
0.06834
|
|
13:25
|
0.04
|
0.02583
|
0.04
|
0.0475
|
0.09417
|
|
13:30
|
0.02583
|
0.0125
|
0.02583
|
0.07333
|
0.10667
|
|
13:35
|
0.01583
|
0.005
|
0.01583
|
0.08916
|
0.11167
|
|
13:40
|
0.009
|
0.00167
|
0.009
|
0.09816
|
0.11334
|
|
13:45
|
0.00417
|
0
|
0.00417
|
0.10233
|
0.11334
|
|
13:50
|
0.00333
|
0
|
0.00333
|
0.10566
|
0.11334
|
|
13:55
|
0
|
0
|
0
|
0.10566
|
0.11334
|
|
14:00
|
0
|
0
|
0
|
0.10566
|
0.11334
|
Comparison 6/26/09:
|
26-Jun-09
|
5-minute
|
5-minute
|
|
Total
|
Total
|
|
PDT
|
WunderG
|
NEXRAD
|
|
WunderG
|
NEXRAD
|
|
Date
|
KFLBOCAR4
|
N0R
|
|
KFLBOCAR4
|
N0R
|
|
9:00
|
0
|
0
|
|
0.000
|
0.000
|
|
9:05
|
0
|
0.00083
|
|
0.000
|
0.001
|
|
9:10
|
0
|
0.00417
|
|
0.000
|
0.005
|
|
9:15
|
0
|
0.00083
|
|
0.000
|
0.006
|
|
9:20
|
0
|
0.00083
|
|
0.000
|
0.007
|
|
9:25
|
0
|
0.00083
|
|
0.000
|
0.007
|
|
9:30
|
0
|
0.00417
|
|
0.000
|
0.012
|
|
9:35
|
0.02
|
0.02583
|
|
0.020
|
0.037
|
|
9:40
|
0.00833
|
0.0125
|
|
0.028
|
0.050
|
|
9:45
|
0.08833
|
0.02583
|
|
0.117
|
0.076
|
|
9:50
|
0.18917
|
0.0525
|
|
0.306
|
0.128
|
|
9:55
|
0.0275
|
0.0525
|
|
0.333
|
0.181
|
|
10:00
|
0.0275
|
0.0125
|
|
0.361
|
0.193
|
|
10:05
|
0.010835
|
0.0125
|
|
0.372
|
0.206
|
|
10:10
|
0.010835
|
0.0125
|
|
0.383
|
0.218
|
|
10:15
|
0.00667
|
0.0125
|
|
0.389
|
0.231
|
|
10:20
|
0.00667
|
0.00417
|
|
0.396
|
0.235
|
|
10:25
|
0.00533
|
0.00417
|
|
0.401
|
0.239
|
|
10:30
|
0.007
|
0.0125
|
|
0.408
|
0.252
|
|
10:35
|
0.00333
|
0.00417
|
|
0.412
|
0.256
|
|
10:40
|
0
|
0.00417
|
|
0.412
|
0.260
|
|
10:45
|
0
|
0.0125
|
|
0.412
|
0.273
|
|
10:50
|
0
|
0.0125
|
|
0.412
|
0.285
|
|
10:55
|
0.019165
|
0.02583
|
|
0.431
|
0.311
|
|
11:00
|
0.019165
|
0.02583
|
|
0.450
|
0.337
|
|
11:05
|
0.015
|
0.02583
|
|
0.465
|
0.362
|
|
11:10
|
0.01417
|
0.02583
|
|
0.479
|
0.388
|
|
11:15
|
0.01167
|
0.02583
|
|
0.491
|
0.414
|
|
11:20
|
0.00833
|
0.02583
|
|
0.499
|
0.440
|
|
11:25
|
0.01417
|
0.02583
|
|
0.513
|
0.466
|
|
11:30
|
0.00917
|
0.0125
|
|
0.522
|
0.478
|
|
11:35
|
0.0075
|
0.0125
|
|
0.530
|
0.491
|
|
11:40
|
0.005
|
0.0125
|
|
0.535
|
0.503
|
|
11:45
|
0.005
|
0.00417
|
|
0.540
|
0.507
|
|
11:50
|
0.005
|
0.00167
|
|
0.545
|
0.509
|
|
11:55
|
0
|
0.00417
|
|
0.545
|
0.513
|
|
12:00
|
0
|
0.00417
|
|
0.545
|
0.517
|
|
12:05
|
0
|
0.00083
|
|
0.545
|
0.518
|
|
12:10
|
0
|
0
|
|
0.545
|
0.518
|
|
12:15
|
0
|
0.005
|
|
0.545
|
0.523
|
|
12:20
|
0
|
0.02583
|
|
0.545
|
0.549
|
|
12:25
|
0.00583
|
0.02583
|
|
0.551
|
0.575
|
|
12:30
|
0.00583
|
0.0125
|
|
0.557
|
0.587
|
|
12:35
|
0.005
|
0.00417
|
|
0.562
|
0.592
|
|
12:40
|
0.005
|
0.0125
|
|
0.567
|
0.604
|
|
12:45
|
0.005
|
0.00417
|
|
0.572
|
0.608
|
|
12:50
|
0.00333
|
0.00417
|
|
0.575
|
0.612
|
|
12:55
|
0.00333
|
0.0125
|
|
0.578
|
0.625
|
|
13:00
|
0.00333
|
0.0125
|
|
0.581
|
0.637
|
|
13:05
|
0.00333
|
0.0125
|
|
0.585
|
0.650
|
|
13:10
|
0.00333
|
0.00417
|
|
0.588
|
0.654
|
|
13:15
|
0.00333
|
0.00417
|
|
0.591
|
0.658
|
|
13:20
|
0.00333
|
0.00417
|
|
0.595
|
0.663
|
|
13:25
|
0
|
0.00417
|
|
0.595
|
0.667
|
|
13:30
|
0
|
0.00417
|
|
0.595
|
0.671
|
|
13:35
|
0
|
0
|
|
0.595
|
0.671
|
Comparison 6/27/09:
(data table not included)
Looks like the radar missed a hail storm for 5 minutes. ;)
Comparison 6/28/09:
(data table not included)
Summary of Comparisons:
|
|
KFLBOCAR4
|
N0R
|
Peak
|
Total
|
R squared
|
R squared
|
|
Date
|
Total inch
|
Total inch
|
% Diff
|
% Diff
|
w/o t shift
|
w/ t shift
|
|
24-Jun-09
|
0.11
|
|
31%
|
7%
|
0.11
|
0.94
|
|
26-Jun-09
|
0.60
|
|
-72%
|
13%
|
0.41
|
0.11
|
|
27-Jun-09
|
0.426
|
|
-82%
|
-77%
|
0.007
|
0.87
|
|
28-Jun-09
|
0.28
|
|
-63%
|
-33%
|
0.67
|
0.11
|
That’s it. I’m getting a new
Wundergage. One on a golf course
that would have a need to maintain an accurate rainfall record. KFLPOMPA12 looks like a good choice
about 5 miles south.
Comparison 6/28/09 New Wunder Gage
KFLPOMPA12:
(data table not included)
Comparison 6/28/09 Wunder Gage
KFLPOMPA12:
(data table not included)
Comparison 6/28/09 Wunder Gage
KFLPOMPA12:
(data table not included)
Comparison 6/30/09 Wunder Gage
KFLPOMPA12:
(data table not included)
Summary of Comparisons:
|
|
KFLPOMPA12
|
N0R
|
Total
|
Peak
|
R squared
|
R squared
|
|
Date
|
Total inch
|
Total inch
|
% Diff
|
% Diff
|
w/o t shift
|
w/ t shift
|
|
28-Jun-09
|
0.37
|
0.38
|
3%
|
47%
|
0.18
|
0.45
|
|
29-Jun-09
|
0.11
|
0.12
|
9%
|
-100%
|
0.18
|
0.20
|
|
29-Jun-09
|
0.92
|
0.95
|
3%
|
-40%
|
0.13
|
0.16
|
|
30-Jun-09
|
0.41
|
0.33
|
-20%
|
-46%
|
0.12
|
0.41
|
Executive Summary:
Well... in a nutshell... the Wunderground rainfall gages should be taken out and
summarily executed. They are all
full of leaves, sticks, and dead wasps as far as I can tell. Don't you Wundergrounders
have a conscience? That is my executive summary!!! I have to edit their time
steps, delete bogus spikes, and I'm supposed to make comparisons?!! It's the
radar way or the highway if you have to stoop to using Wunderground rainfall.
Although their Temp, Humidity, and Wind Speed are excellant for computing ET. ;-)
(Update... I may have gotten the Wunder Gages all wrong... It's the radar stupid!)
After finally asking for help on N1P, the Nexrad Radar Operations Center
directed me to their Handbook
FMH-11, Part C. Chapter 3.3 tells us that the N1P (hourly priciptation) may
be adjusted for gage-radar bias but the adjustment is a single value applied to
the whole radar coverage. This is why one should ALWAYS double check their own
sub area of interest's gage bias and make your own adustment to the N0R
reflectivity Z-R relation as needed.
Fit
the Second (On going comparisons... Ai yi yi!)
They sought it with thimbles, they sought it with care;
They pursued it with forks and hope;
They threatened its life with a railway-share;
They charmed it with smiles and soap.
They shuddered to think that the chase might fail,
And the Beaver, excited at last,
Went bounding along on the tip of its tail,
For the daylight was nearly past.
Then, silence. Some fancied they heard in the air
A weary and wandering sigh
Then sounded like "-jum!" but the others declare
It was only a breeze that went by.
They hunted till darkness came on, but they found
Not a button, or feather, or mark,
By which they could tell that they stood on the ground
Where the Baker had met with the Snark.
In the midst of the word he was trying to say,
In the midst of his laughter and glee,
He had softly and suddenly vanished away---
For the Snark *was* a Boojum, you see.
I'M KIDDING!!!! I'm not as foolish as Lewis Carol!
Ok, that's it.
I have installed a rain gage outside my office window (305,244) and will be doing the next
rainfall comparison myself with binoculars and a timer. Rocket science would be easier than
getting a rainfall record. My Plastic Gage is located 19 miles north of
the ESX radar, mid-beam base scan elevation = 6,010 ft.
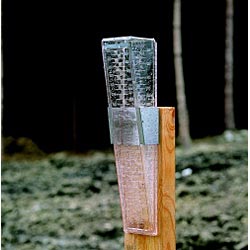
It could be weeks if not months for the next desert rainfall here… but I’m ready
now!
Ft Lauderdale, Fl Wunder Gage KFLCORAL5:
(hmmm... I just noticed KFLCORAL5 was the Wunder gage I started out here with.
Ok, I could be as foolish as Lewis Carol.)
Waiting for it to rain in the desert makes watching paint dry child's play. So
to fill in something here I have moved my Ft Lauderdale gage (again) based on a
grouping of Wunder gages in the area that seemed to report about the same
rainall for each event and selected one in the middle KFLCORAL5 on August 16. I
will update this graph as rainfall events occur. If you can't get a temporal AND
spatial correlation, then increase one or the other... here I have increased the
temporal and the 8 inch diameter versus 1/2 mile diameter spatial is what it is:
Fort Lauderdale
Wunderground Gage, N0R, and N1P:
After again noting peak N0R 5 minute rainfall versus KFLCORAL5 tipping bucket
constant drizzle I have once again moved back to nearby Wundergage
KFLPARKL4
that shows similar peaks as N0R for the last storm... Storm Chaser!!!
Wunderground rain gauge is located 52 miles north of AMX radar site. After
KFLPARKL4 reported only 10% of the 5-minute actual rainfall on July 13, 2010 I
have moved back to nearby
KFLBOCAR4 that reported a nice spiked 2.37 inch down pour.
GetRealtime.exe 1.3.9 has been updated to change the 1-Hour Total N1P rainfall
calculation to the same used as N0R and NCR. Trying to work with the change in
N1P values on a regular time step wasn't working out. The event totals are now
correct but the high intensity 5 minute events are now averaged over several
time steps so that's not very good for small basin runoff computations. Oh well,
N1P always way under reports rainfall anyway and should not be used no how. I
continue charting the N1P just to prove this point.
OOPS!!! Wouldn't you know my very next chart shows N1P performing better than
N0R. Ok, but it's still a rule of thumb.
Well the daily accumulations for the first half of December are just terrible,
terrible is what it is. So I tried correlating the Wundergage 5-minute rainfall
with the N0R with very poor results so I just took a stab at changing the DBZ to
Rainfall Rate relations (with hardly any justification). I have updated
Getrealtime to let users put there own rates in the setup SHIFT cell like this:
NEXRAD-AMX; 10915; Rainfall; Ft Lauderdale N0r; 0; 0.00, 0.00,0.02,.04,.09,.21,1,2,4
(dont forget that 0 goes in the BASE cell or other limiting value then the
10 dbz to change=0.00 etc.)
Note that not all the upper rates are needed if not revised. I have updated
GetNerad.exe to allow users to change the rainfall rates in the same manner by
including the optional file 'Dbz2Rainrate.txt' that has just the one line that
looks likes this:
0.00, 0.00,.02,.04,.09,.21,1,2,4 starting with 10 dbz to change
Here is how the revised graphs for December look so far:
(Moved from KFLCORAL4
back to the KFLCORAL5 Wundergage after July 30 and returned to standard
Convective dbz
rates.)
Since lowering the z-r rates on July 30 from my made up ones to the standard
convective rates, the N0R radar rainfall is under estimating the Wundergage. To
fix this the rainfall event of August 29 was evaluted using the standard
Convective, Tropical, and 'Semi-Tropical' rates shown above. The Semi-Tropical was the
average of the Convective and Tropical rates. Here is the Aug 29 comparison:
WunderGage = 1.70 inches
Semi-Tropical = 1.73 inches
Tropical = 2.30 inches
Convective= 1.30 inches
My 'Semi-Tropical' N0R dBz to rainfall rates are:
0; 0.00,0.00,0.02,0.04,0.11,0.27,0.67,1.66,4.15,6.86,7.0,7.5,8.0,8.5
and were put into use on August 30, 2010.
Water Year 2011...
The continuous NEXRAD point rainfall 5-minute record sequence and the tipping
bucket sequence of computed runoff for a hypothedical 1 square mile basin has
been computed below in real-time by GetRealtime. A 1-hour lag was chosen so as
not to cripple the N1P 5-minute record right off the bat. This elimanates any
actual basin characteristcs and shows the effect of only the difference in
rainfall records. The MAE here is the mean absolute error
of daily percent differences between the tipping bucket and the
radar peak flows.
Dallas, TX Wunderground Gage
KTXDALLA46 and N0R:
Wunderground rain gauge is located 33 miles northwest of FWS radar site,
mid-beam base scan elevation = 3,160 ft.
Moved to
KTXDALLA70 after July 30, 2010 and then back on Oct 1, 2010..
Water Year 2011...
Moved back to KTXDALLA46 beginning Oct 1, 2010.
Moved to
MD5602 beginning Jan 6, 2011. (fly by nights and rediculous time steps... have you WU's no shame!)
The continuous NEXRAD point rainfall 5-minute record sequence and the tipping
bucket sequence of computed runoff for a hypothedical 1 square mile basin has
been computed below in real-time by GetRealtime. A 1-hour lag was chosen so as
not to cripple the N1P 5-minute record right off the bat. This elimanates any
actual basin characteristcs and shows the effect of only the difference in
rainfall records. The MAE here is the mean absolute error
of daily percent differences between the tipping bucket and the
radar peak flows.
Collinsville, TX Wunderground Gage
KTXCOLLI1 and
FWS N0R:
Wunderground rain gauge is located 72 miles north of FWS radar site, mid-beam
base scan elevation = 6,950 ft. The Wundergage KTXCOLLI1 at Collinsville
has been down since 9/25/2010 and so the nearby
KTXWHITE10 and its radar pixel was filling inthrough 3/8/2011.
Water Year 2011...
The continuous NEXRAD point rainfall 5-minute record sequence and the tipping
bucket sequence of computed runoff for a hypothedical 1 square mile basin has
been computed below in real-time by GetRealtime. A 1-hour lag was chosen so as
not to cripple the N1P 5-minute record right off the bat. This elimanates any
actual basin characteristcs and shows the effect of only the difference in
rainfall records. The MAE here is the mean absolute error
of daily percent differences between the tipping bucket and the
radar peak flows.
Groveland, CA Wunderground Gage
MAP893 (Sierra Nevada foothills 2500' elv) and
N0R, N1P:
This Wunder Gage comparison is now using 2 radar sites, DAX located 91 miles to the northwest and HNX located 111 miles to the south. The range of the display for these radar sites are 143 miles.
It will be interesting to see how much of a difference a radar site calibration,
beam elevation, and/or its distance will make. So far it looks like most
of the winter rainfall is occurring below the 10,000 foot scan elevation of the
radar beam with the closer (and lower beam) DAX radar doing better than the
further HNX radar.
I'll even go out on a limb here and say, "This is the worst radar site in the
nation!" Oh wait... I'm adding some snow water equivilant radar comparisons
at the 7,000 foot elevation that will make this lame site look peachy!
Water Year 2011...
The two radar sites, DAX atenna at elevation 141 ft, HNX at 338 ft, lowest angle 0.5 radar beams at 91 and 111 mile range will
be measuring two different elevations of scan volumes over the Wundergage as
shown below.
Buck Meadows, CA Wunderground Gage
MBMEC1 (Sierra Nevada foothills 3200' elv) and N0R:
Wunderground rain gauge is located 98 miles southeast of the DAX radar site,
mid-beam base scan elevation = 9,800 ft in the Big Creek basin with Nexrad to
USGS
rainfall-runoff comparison here.
Water Year 2011...
Tracy, CA Wunderground Gage
KCATRACY11 (San Joaquin Valley 130' elv) and DAX
radar:
Wunderground rain gauge is located 53 miles south of the DAX radar site,
mid-beam base scan elevation = 4,200 ft.
The vertical stepping on the Tracy and McFarland charts below are due to zero
reported tipping bucket rainfall while the radar reports non-existant rainfall
in clear air mode. Always something.
Water Year 2011...
The continuous NEXRAD point rainfall 5-minute record sequence and the tipping
bucket sequence of computed runoff for a hypothedical 1 square mile basin has
been computed below in real-time by GetRealtime. A 1-hour lag was chosen so as
not to cripple the N1P 5-minute record right off the bat. This elimanates any
actual basin characteristcs and shows the effect of only the difference in
rainfall records. The MAE here is the mean absolute error
of daily percent differences between the tipping bucket and the
radar peak flows.
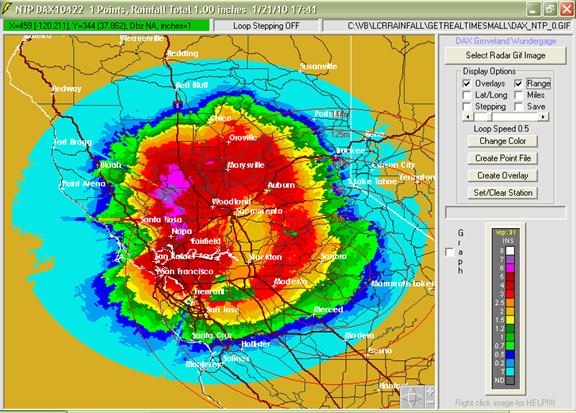
The picture above says it all, or as Rod Stewart says, "Every picture tells a
story don't it." The picture says it only rains in a circle around the
radar site. These 2 Wunderground gage sites out on the perimeter paint a
two different pictures:
NTP Storm Total for Jan 16-21, 2010 (inches)
Tracy X=326 (-121.433), Y=362 (37.697) 57 miles from radar site
Wundergage=2.12 NTP Storm Total=1.5 N0R=3.36 N1P=1.41
Groveland X=459 (-120.211), Y=344 (37.862) 91 miles from radar site
Wundergage=5.07 NTP Storm Total=1.0 N0R=1.09 N1P=0.7
Actually I may have been misled with the curvature of the earth and beam angle
causing radar beam over shoot. It probably has nothing to do with that. Beam
spreading and beam refraction with distance from the DAX radar site is probably
the cause of under estimating rainfall beyond about 70 miles.
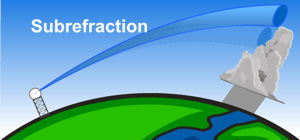
I should have done my homework at the
NWS Online
School for Weather. Refraction may also explain why winter type storms
are "over shot". The atmosphere denisty distribution is probably not as normal
as summer type densities. If it aint one thing its another and it's a wonder
anything works at all. I am so full of baloney but if you want more overshoot
speculations go to
my Snowfall
Comparisons page.
The Online School for Weather also recommends using NCR instead of N0R images
for certain cases. The advantage of Composite Reflectivity is in mountainous
regions. Often, the Base Reflectivity ½° elevation scan is not high enough to
see over mountains. With the addition of higher elevations scans, weather
information over mountain peaks can be seen.
I have replaced the Groveland DAX N1P record with the NCR record beginning Feb 1,
2010. We shall see how the NCR performs. The HNX radar NCR has replaced
the N1P record
for Groveland also.
McFarland, CA Wunderground Gage
KCAMCFAR2(San Joaquin Valley 342' elv) and HNX N0R:
Wunderground rain gauge is located 49 miles southeast of HNX radar site,
mid-beam scan elevation = 3,900 ft.
Water Year 2011...
The continuous NEXRAD point rainfall 5-minute record sequence and the tipping
bucket sequence of computed runoff for a hypothedical 1 square mile basin has
been computed below in real-time by GetRealtime. A 1-hour lag was chosen so as
not to cripple the N1P 5-minute record right off the bat. This elimanates any
actual basin characteristcs and shows the effect of only the difference in
rainfall records. The MAE here is the mean absolute error
of daily percent differences between the tipping bucket and the
radar peak flows.
USGS Diamond Creek, AZ Tipping Bucket Gage
09404208 (canyon lands 1400' elev) and Radar ESX-N0R:
USGS rain gauge is located 85 miles east of ESX radar site (Las Vegas).
USGS Big Sandy, AZ Tipping Bucket Gage
09424450 (Sonoran Desert 1400' elev) and Radars ESX, FSX, and
IWA N0R:
USGS rain gauge is located 112 miles southeast of ESX radar site (Las Vegas).
USGS rain gauge is located 139 miles west of FSX radar site (Flagstaff).
USGS rain gauge is located 138 miles northwest of IWA radar site (Phoenix).
Mid-Beam Scan Elevation:
ESX = 16,900 ft
FSX = 24,400 ft
IWA = 18,430 ft
USGS Santa Maria, AZ Tipping Bucket Gage
09424900 (Sonoran Desert 1360' elev) and Radars ESX, FSX, and
IWA N0R:
USGS rain gauge is located 131 miles southeast of ESX radar site (Las Vegas).
USGS rain gauge is located 125 miles west of FSX radar site (Flagstaff).
USGS rain gauge is located 119 miles northwest of IWA radar site (Phoenix).
Mid-Beam Scan Elevation:
ESX = 20,190 ft
FSX = 21,680 ft
IWA = 14,820 ft
Wundergage Camp Wood, AZ
MCPWA3 (Upper Sonoran Pines 5750' elev) and Radars ESX, FSX, and
IWA N0R:
Rain gauge is located 130 miles southeast of ESX radar site (Las Vegas).
Rain gauge is located 97 miles west of FSX radar site (Flagstaff).
Rain gauge is located 126 miles northwest of IWA radar site (Phoenix).
Mid-Beam Scan Elevation:
ESX = 20,070 ft
FSX = 17,170 ft
IWA = 15,990 ft
Ongoing Summary Table for WY2011 updated daily
% Difference is the error in total rainfall, a measure of bias.
MAE % is the mean of the individual daily unsigned differences, a
measure of error variablility.
As an example through 1/8/2011, the AMX radar N0R at the Ft Lauderdale tipping
bucket has tended to under report the daily rainfall by 34% (% Dif) with inidividual
daily rainfall being within 35% (MAE%) of the tipping bucket about half the time while
the radar N1P has a 75% under bias and is within 79% only half the time... a
real horror story. The continuous real-time N0R and N1P 5-minute
radar rainfall record for a hypothedical basin (see above graphs) at Ft
Lauderdale produce daily peak flows that tend to differ from the tipping bucket
peaks by more than 66% and 98% half the time according to their listed MAE's.
A little mis-leading. Not alot of values yet and the highest peak flows at each
site are not so bad.
For example, the chart below shows daily unsigned errors vs daily rainfall
amount for Ft Lauderdale.
Looks like the Snark has made a clean getaway. I should probably put some
threshold on what is considered 'real rain' here or something to help these poor
radars out.
Statistical collary to a Snark hunt: Sure a sports handicapper could tell you
who will be leading next weeks standings but if half the time he is 100% wrong
on predicting next weeks game he would be out of business.
Important Note: I just noticed something while viewing a looping
storm in GetNexrad.exe. In very zoomed in mode there are radar cells or pixels
that are just duds. They report no refelectivity at all on all images. There
locations were verified on the unzoomed original image also just to be sure.
Some come and go but you may want to be sure your point location is not a dud by
zooming in on it. If it aint one thing it's another.
For more comparisons, see a network of tipping buckets that are on my
Rainfall-Runoff Comparisons web page for
Las Vegas Valley, Nv.
Another ongoing Nexrad radar rainfall to runoff comparison for Big Creek
near Groveland, CA in the San Joaquin Valley foothills is on
my web page
here. For my comparisons of runoff for some very large basins (1 to 2
thousand sq.mi.) in the western
Arizona deserts go here.
For an on going Snowfall comparison see my
Sierra Snowfall Comparisons web page. The Sierra Snowfall page also
includes two SNOTEL gages near Flagstaff AZ, one near Fargo ND, and further discussion and calculation
of radar beam over shoot.
|